v4.0 [May 3, 2016]
-Principal Components Analysis (PCA) – Principal component analysis is a technique for reducing the complexity of high-dimensional data by approximating the data with fewer dimensions.
-Analysis of Covariance (ANCOVA) – Analysis of Covariance is an extension of ANOVA (Analysis of Variance) obtained by specifying one or more covariates as additional variables in the model.
-Cox Regression – This includes the proportional hazards model with stratification to study the impact of potential risk factors on the survival time of a population. The input data can be categorical.
-One-Sample T-test – Tests the hypothesis that the mean of a population equals a specified value.
-Odds Ratio and Relative Risk tests – Both tests the hypothesis that a treatment has no effect on the rate of occurrence of some specified event in a population. Odds Ratio is used in retrospective studies to determine the treatment effect after the event has been observed. Relative Risk is used in prospective studies where the treatment and control groups have been chosen before the event occurs.
-Shapiro-Wilk Normality test – A more accurate test than Kolmogorov-Smirnov for assessing the normality of sampled data. Used in assumption checking for many statistical tests, but can also be used directly on worksheet data.
-New Result Graph – ANOVA Profile Plots: Used to analyze the main effects and higher-order interactions of factors in a multi-factor ANOVA design by comparing averages of the least square means.
-New Probability Transforms – Thirty four new functions have been added to SigmaStat’s Transform language for calculating probabilities and scores associated with distributions that arise in many fields of study.
-New Interface Change – Nonlinear Regression: An easy to use wizard interface and more detailed reports.
-New Interface Change – Quick Transforms: An easier way of performing computations in the worksheet.
-New Interface Change – New User Interface: Allows the user to work more easily with Excel worksheets.
Yates correction added to the Mann-Whitney test – Yates correction for continuity, or Yates chi-square test is used when testing for independence in a contingency table when assessing whether two samples of observations come from the same distribution.
- Improved Error Messaging – Improved error messages have added information when assumption checking for ANOVA has failed.
- Deming Regression – Deming regression allows for errors in both X and Y variables – a technique for method comparison where the X data is from one method and the y data the other. The Deming regression method basically extends the normal linear regression, where the X values are considered to be error-free, to the case where both X and Y (both methods) have error. Hypotheses can then be tested, slope different from 1.0 for example, to determine if the methods are the same. For example, it might be used to compare two instruments designed to measure the same substance or to compare two algorithmic methods of detecting tumors in images. The graph compares the two methods to determine if they are different or the same. A report gives statistical results.
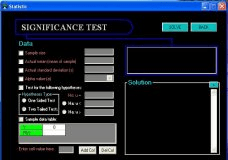
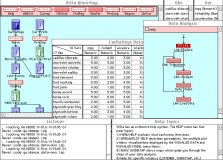
Evaluates statistics and training sessions, compatible with all ROX series, etc.
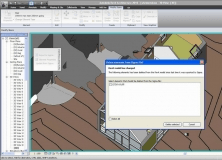
It makes it possible to export and import your model from Revit to Sigma.